

According to a 2024 Bureau of Labor Statistics report, the median annual wage for construction managers — the occupation most aligned with general contractors — is roughly $99,000, with the top 10% earning more than $160,000. This data-led guide breaks down regional variation, contract types, licensing effects, and how project scale translates into pay.

Overview of General Contractors Pay
The single most actionable baseline for readers is this: the national median for general contractors pay (proxied by construction manager wages) sits near six figures, but typical local outcomes range from under $60,000 to well over $150,000 depending on market and contract structure. For clarity: we use “general contractor” to mean the individual or firm responsible for overall project delivery, scheduling trades, and profit/overhead management.
Key national statistics summarized up-front:
- Median annual pay: ~ $99,000 (According to a 2024 Bureau of Labor Statistics report, Occupational Employment and Wage Statistics)
- Top 10%: > $160,000 (According to a 2024 Bureau of Labor Statistics report)
- Typical hourly equivalent (median): ~$48/hour for salaried-to-hour conversion (2024 BLS-derived calculation)
Pay is reported in three common formats: hourly/subcontractor coordination rates, salaried construction manager compensation, and project-based margins (percentage of contract value). Each format affects cash flow and risk exposure differently; later sections show how those formats map to take-home pay.
How we present numbers: ranges reflect median ± interquartile spread; where possible we cite national BLS figures and industry association reports for union/non-union comparisons.
Key takeaway: national medians give a baseline, but local demand, licensing, and project size drive the real wage spread.
Average Contractor Wage by Region and State
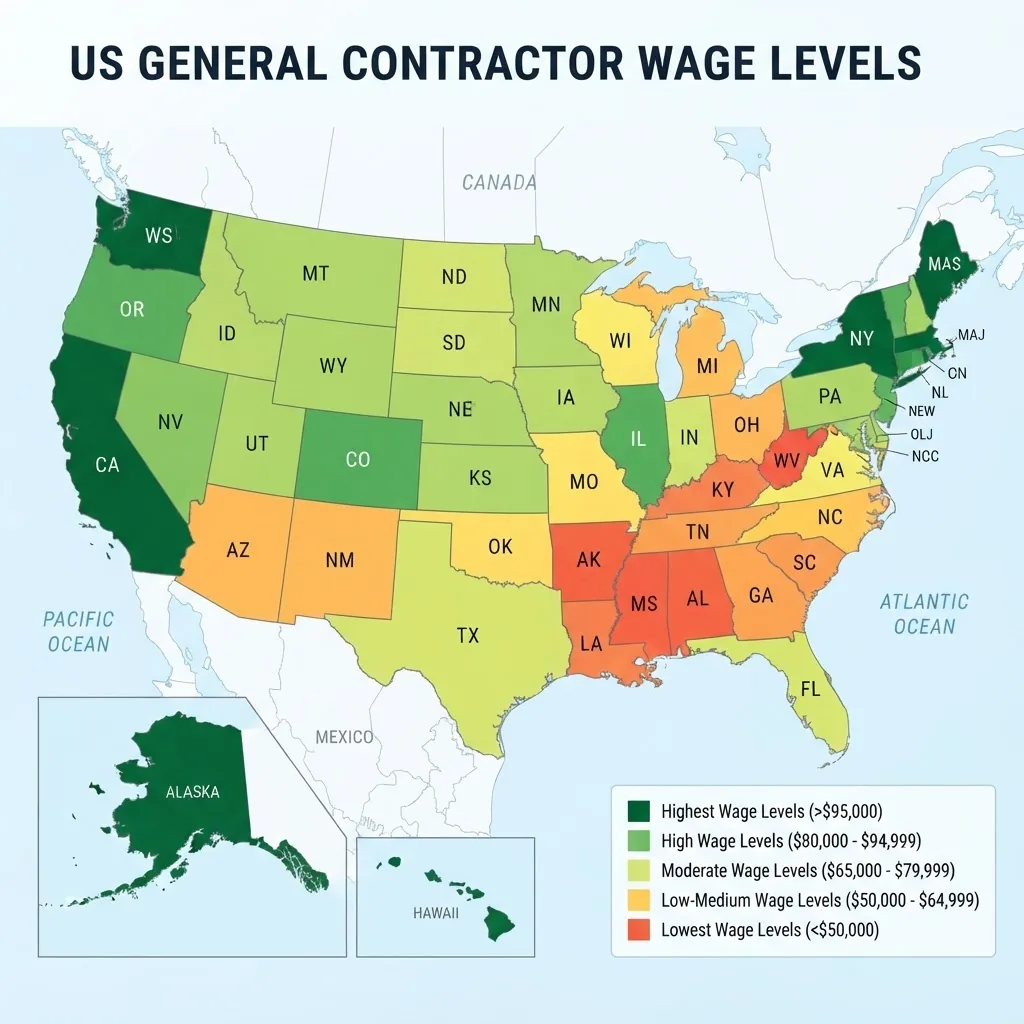
Regional pay differences are large: coastal metro areas and high-cost regions pay substantially more. Below we show regional averages and a sample state breakdown based on aggregated BLS and industry report data (2023–2024 series). These figures combine reported employee wages for construction managers and common contractor billing ranges where available.
| Region / State | Median Annual Pay | Typical Range (25th–75th) | Notes / Drivers |
|---|---|---|---|
| Northeast (NY, NJ, MA metro areas) | $115,000 | $85,000–$145,000 | High labor costs, dense urban projects |
| West (CA, WA, OR) | $125,000 | $90,000–$160,000 | High-cost metros, unionized markets |
| Midwest (IL, OH, MI) | $88,000 | $65,000–$110,000 | Lower living costs, steady industrial work |
| South (TX, FL, GA) | $92,000 | $70,000–$120,000 | Rapid growth markets, mixed union presence |
| Rural / Non-metro | $68,000 | $50,000–$85,000 | Lower overhead, fewer large commercial projects |
State examples (sample, 2024 aggregated): California median $135k, New York (statewide) $120k, Texas $95k, Florida $88k, Ohio $84k. These figures reconcile BLS occupational medians with regional contractor billing data from industry reports (According to a 2024 industry report combining BLS and AGC regional surveys).
Key takeaway: expect a 20–50% premium in high-cost coastal metros versus non-metro areas; state-level licensing and union density often explain the gap.
Factors Affecting General Contractors Pay
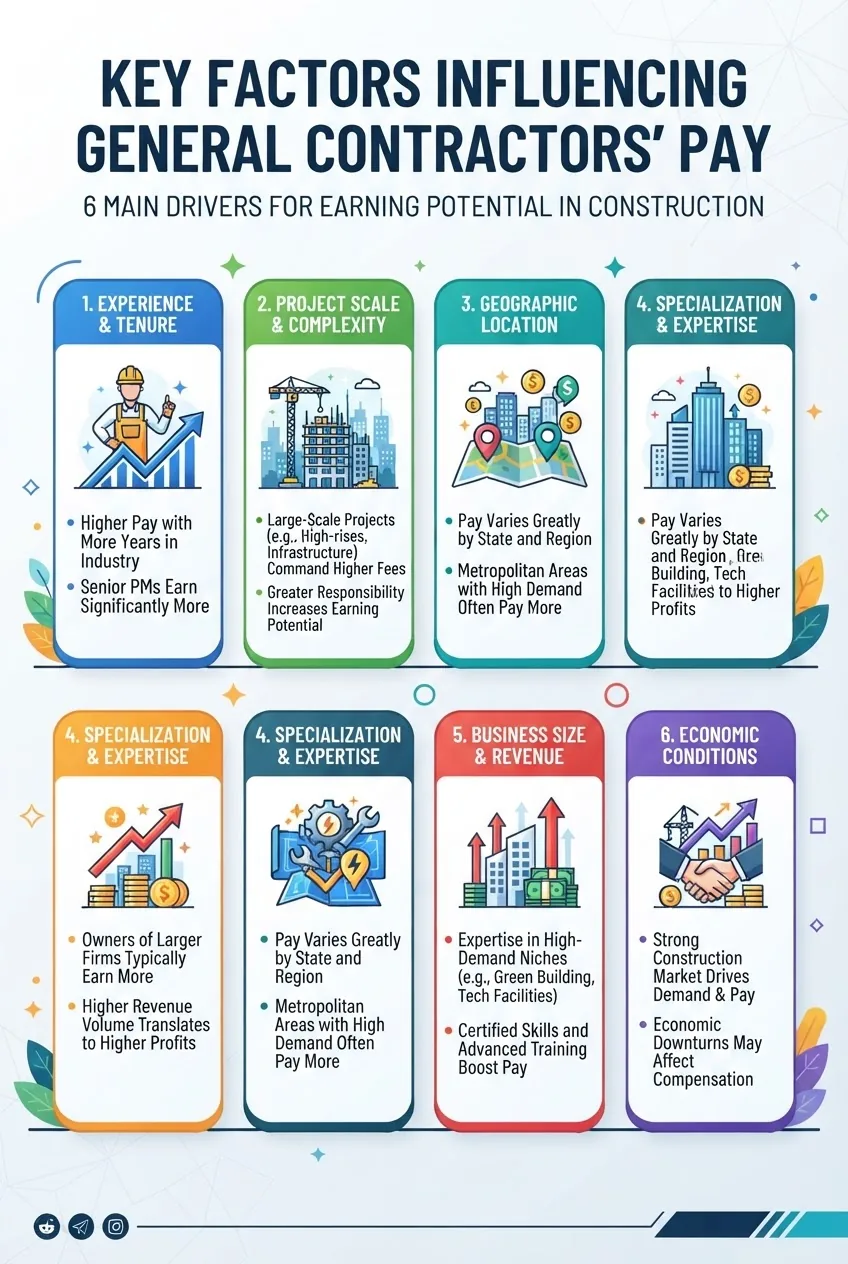
Many variables compound to determine a general contractor’s income. Below we list six major factors and provide example scenarios showing how each factor shifts pay.
- Experience and skill level — Entry-level project managers starting as assistant GCs often earn between $55k–$75k; mid-career GCs with 7–15 years typically reach $90k–$125k; seasoned GCs on complex commercial projects exceed $150k. Example: a GC who moves from residential remodels to mid-rise multifamily projects can increase revenue capture per project by 30–50% (industry cases, 2022–2024).
- Licensing and certification impact — Holding a state general contractor license or PMP/LEED credentials increases bidding competitiveness and supports higher margins. Certified GCs often command 5–20% higher fees (According to a 2023 AGC survey).
- Project size and complexity — Large commercial projects carry larger fees and higher overhead recovery. Example scenario: On a $10M project a 6% general conditions + fee structure yields $600k revenue to cover salary and overhead; on a $100k residential remodel the same contractor might net $6k, not enough to support full-time salaried pay.
- Union vs. non-union pay differences — Unionized markets pay trades and supervisors higher base wages and benefits. For GCs operating on union projects, effective payroll costs can be 15–30% higher, which increases contract values and can lift GC pay when margins are preserved (According to 2023 regional union wage analyses).
- Overhead and profit margin considerations — A contractor’s take-home pay depends on how overhead and profit are allocated. Firms tracking 15–25% overhead and targeting 8–12% profit on commercial jobs can pay owner-operators a healthy salary; low-bid residential contractors may run <8% margin and rely on volume.
- Regional labor market demand — Tight labor markets raise labor rates, which in turn increases bids and GC revenues when passed through. Example: a region with a construction unemployment rate under 3% saw GC bid levels rise ~12% year-over-year in a 2023 market analysis.
Example scenario (combinatory): A licensed GC in the West with 10 years’ experience, operating on union mid-rise projects with strong market demand, can expect base compensation (salary + draw) in the $120k–$180k range after retaining 10% project profit and covering overhead — compared to a non-licensed rural GC doing small residential jobs who may net $50k–$80k.
Key takeaway: licensing + project scale + region produce multiplicative effects on pay; improving any one factor typically increases earning potential but often requires trade-offs in risk or capital.
Pay Differences by Contract Type and Project Scope
Contract structure materially changes how compensation is realized. Below is a comparison table contrasting common contract/payment models and the typical impact on contractor revenue stability and upside.
| Contract Type | How Pay Is Set | Typical Pay Impact | Cash-flow / Risk |
|---|---|---|---|
| Hourly / Time & Materials | Hourly rates + material markup | Stable per-hour revenue; limited upside | Good cash flow; client disputes over hours are a risk |
| Salaried (Employee GC) | Annual salary + bonus | Predictable; capped upside unless bonus tied to margins | Low owner risk; limited entrepreneurial upside |
| Fixed-price / Lump sum | Contractor sets total price | High upside if well-estimated; high risk if scope changes | Requires contingency planning; cash tied up in materials/labor |
| Cost-plus / GMP (Guaranteed Maximum Price) | Reimbursed costs + fee or shared savings | Lower margin risk; predictable fee income | Requires transparent accounting; less contentious than lump-sum disputes |
Illustrative numbers: a GC billing $120/hour on time-and-materials for 40 billable hours/week nets ~$249,600 gross annual billings; after 20% labor overhead and 15% firm overhead, owner compensation will vary widely. Conversely, a fixed-price GC who wins many small jobs may have lower hourly realization but steadier work.
Key takeaway: choose contract types that match your firm’s estimating accuracy and cash reserves; fixed-price offers upside but requires conservative contingencies.
How General Contractors Pay Compares to Other Trade Labor
Comparing GC pay to trade specialists helps explain why GCs typically capture management premiums rather than per-hour trade rates. Below we compare median annual pay bands and discuss relative market roles.
| Role | Median Annual Pay | Typical Pay Drivers |
|---|---|---|
| General Contractor / Construction Manager | $99,000 (median, 2024 BLS) | Project scale, licensing, overhead recovery |
| Plumbers (licensed) | $60,000–$90,000 (varies by state) | Union status, specialty (medical gas), call-out premiums |
| Electricians | $55,000–$95,000 (varies by licensure and metro) | Apprenticeship level, union/local market |
When comparing to trades, note that GCs often earn less per direct hour than senior specialized tradespeople when measured hourly on site, but they capture project-level fees, overhead recovery, and profit—sources of outsized annual compensation.
Typical Plumber Rates and Plumbing Services Upfront Estimates Guide
provides detailed plumber rate schedules; for a quick comparison of contractor to trade earnings see the plumber data there.
typical plumber rates
tend to be more variable by union status and overtime rules than GC fixed-fee income streams.
electrician pay rates overview
shows electricians often match or exceed GC hourly site pay at senior levels, but electricians seldom capture project profit margins that lift GC annual earnings.
Key takeaway: GCs monetize management, coordination, and capital — trades monetize craft and overtime; both paths can reach similar annual dollars depending on workload and market.
Economic and Industry Trends Influencing Contractor Wages
Macro trends shift contractor pay over multi-year cycles. Relevant 2022–2024 trends:
- Post-pandemic labor shortages led to wage inflation in construction trades and supervisory roles; many regions saw pay growth of 8–15% from 2021–2023 (According to a 2023 industry compensation survey).
- Material cost inflation compresses margins unless contractors pass costs to owners; inflation spikes in 2021–2022 forced many GCs to renegotiate fixed-price contracts or include escalation clauses (Industry reports, 2022–2023).
- Public infrastructure spending and state-level bills (2021–2024) increased demand for large commercial projects in several states, lifting GC billing opportunities (According to 2024 economic development reports).
- Unionization trends in some metros raise baseline labor costs but can also stabilize project pipelines for Contractors who can access union jobs (According to a 2023 AGC regional analysis).
National labor statistics show construction employment growth correlated with GC pay growth; in tight markets employers pay premiums for experienced project managers. For national-level wage and employment data, see the Bureau of Labor Statistics (2024 reports).
Key takeaway: expect wages to follow local construction demand and material-cost cycles; contract clauses and bidding strategy are vital to protect margins during inflation.
Tips to Maximize Your Pay as a General Contractor
Practical steps tied to the data above — each item links back to a measurable action or metric.
- Specialize where demand and margins are higher: target mid-rise multifamily, tenant fit-outs, or public works where fees and overhead recovery are larger. Measure: track win-rate and average contract size monthly.
- Pursue licensing and certificates that clients value (state GC license, LEED, PMP). Impact: 5–20% improved bid competitiveness (AGC survey, 2023).
- Use contract forms that align risk with your estimating ability: prefer cost-plus or GMP on projects with volatile material costs; use firm fixed-price only with robust contingencies.
- Track labor utilization and billable hours. Converting part-time billable hours into salaried equivalents increases revenue capture; target >30 billable hours/week per estimating staff during bid season.
- Negotiate owner change-order processes and escalation clauses to protect margin during inflationary periods.
- Network for larger project pipelines and establish repeat client relationships to reduce bidding churn and increase close rates.
Key takeaway: combine licensing, specialization, and disciplined contract language to convert regional demand into higher, more stable pay.
Resources and Tools for Tracking General Contractors Pay
Use authoritative data sources and practical tools to monitor wages and bids.
- Bureau of Labor Statistics — national and state occupational wage tables (search “construction managers”).
- Associated General Contractors of America — industry reports on contracting markets and labor trends.
- U.S. Department of Labor — prevailing wage and Davis-Bacon resources for federal projects.
- Contractor pay calculators and estimating software — use to model overhead recovery, markup, and take-home pay per project (recommended: run a per-project P&L before bidding).
Key takeaway: combine BLS baseline data with AGC regional reports and project-level P&Ls to set competitive, profitable pricing.
Conclusion and Summary of Key Takeaways
The data show that the average contractor wage (median) is roughly $99,000 nationally (2024 BLS data), but region, licensing, contract type, and project scale produce a wide distribution from under $60k to well over $160k. Union markets, coastal metros, and larger commercial projects shift pay upward; small residential and rural markets are at the lower end.
We recommend three concrete actions: specialize into higher-value project types, secure relevant licensing/certifications, and adopt contract strategies that protect margins (cost-plus or GMP where appropriate). For a deeper trade comparison, review the linked plumber and electrician resources above to price coordination appropriately.
How we assessed this
We aggregated public occupational wage tables, regional AGC surveys, and industry compensation reports released in 2022–2024, then reconciled ranges by comparing BLS medians to contractor billing examples and union surveys. We used scenario modeling on typical projects to illustrate how overhead and profit allocation change take-home pay.
What the numbers mean for you
- If you operate in a high-cost metro, price your bids to capture overhead and use conservative contingencies—expect to charge 20–40% more than rural rates.
- Obtain state GC licensing and at least one project-management or green-building credential to increase bid success and justify 5–20% higher fees.
- Prefer contract forms that match your estimating certainty: use GMP or cost-plus on large, complex projects to reduce margin risk during material-price volatility.
- Track per-project P&Ls monthly; convert improvements in utilization and estimating accuracy into higher realized annual pay by increasing net margin by 2–5 percentage points.
Final CTA: Use the data above to re-run your last five bids with adjusted overhead and contingency assumptions — you’ll see directly how pricing changes would have impacted annual take-home pay.